In a three part series, Rajneesh Gupta highlights all the important numbers from cricket World Cups held between 1975 to 2015.
Tournament Results
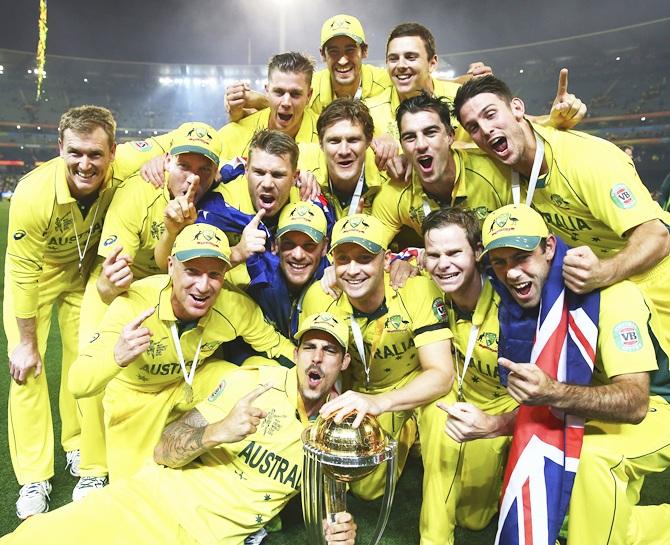
IMAGE: The Australians celebrate with the 2015 World Cup. Photograph: Ryan Pierse/Getty Images
| Country | Years | Played | Winner | Finalist | Semi-finalist |
|---|---|---|---|---|---|
| Australia | 1975 to 2015 | 11 | 5 | 7 | 7 |
| India | 1975 to 2015 | 11 | 2 | 3 | 6 |
| West Indies | 1975 to 2015 | 11 | 2 | 3 | 4 |
| Pakistan | 1975 to 2015 | 11 | 1 | 2 | 6 |
| Sri Lanka | 1975 to 2015 | 11 | 1 | 3 | 4 |
| England | 1975 to 2015 | 11 | 0 | 3 | 5 |
| New Zealand | 1975 to 2015 | 11 | 0 | 1 | 7 |
| Zimbabwe | 1983 to 2015 | 9 | 0 | 0 | 0 |
| South Africa | 1992 to 2015 | 7 | 0 | 0 | 4 |
| Bangladesh | 1999 to 2015 | 5 | 0 | 0 | 0 |
| Kenya | 1996 to 2011 | 5 | 0 | 0 | 1 |
| Canada | 1975,2003,2007 and 2011 | 4 | 0 | 0 | 0 |
| Netherlands | 1996,2003,2007 and 2011 | 4 | 0 | 0 | 0 |
| Ireland | 2007-2015 | 3 | 0 | 0 | 0 |
| Scotland | 1999, 2007 and 2015 | 3 | 0 | 0 | 0 |
| UAE | 1996 and 2015 | 2 | 0 | 0 | 0 |
| East Africa | 1975 | 1 | 0 | 0 | 0 |
| Namibia | 2003 | 1 | 0 | 0 | 0 |
| Bermuda | 2007 | 1 | 0 | 0 | 0 |
| Afghanistan | 2015 | 1 | 0 | 0 | 0 |
Team Results
| Team | Played | Won | Lost | Tied | NR | Win% |
|---|---|---|---|---|---|---|
| Australia | 84 | 62 | 20 | 1 | 1 | 74.69 |
| South Africa | 55 | 35 | 18 | 2 | 0 | 63.63 |
| India | 75 | 46 | 27 | 1 | 1 | 62.16 |
| New Zealand | 79 | 48 | 30 | 0 | 1 | 61.53 |
| West Indies | 71 | 41 | 29 | 0 | 1 | 58.57 |
| Pakistan | 71 | 40 | 29 | 0 | 2 | 57.97 |
| England | 72 | 41 | 29 | 1 | 1 | 57.74 |
| Sri Lanka | 73 | 35 | 35 | 1 | 2 | 49.29 |
| Bangladesh | 32 | 11 | 20 | 0 | 1 | 35.48 |
| Ireland | 21 | 7 | 13 | 1 | 0 | 33.33 |
| Kenya | 29 | 6 | 22 | 0 | 1 | 21.42 |
| Zimbabwe | 57 | 11 | 42 | 1 | 3 | 20.37 |
| Afghanistan | 6 | 1 | 5 | 0 | 0 | 16.66 |
| Canada | 18 | 2 | 16 | 0 | 0 | 11.11 |
| Netherlands | 20 | 2 | 18 | 0 | 0 | 10.00 |
| United Arab Emirates | 11 | 1 | 10 | 0 | 0 | 9.09 |
| Bermuda | 3 | 0 | 3 | 0 | 0 | 0.00 |
| East Africa | 3 | 0 | 3 | 0 | 0 | 0.00 |
| Namibia | 6 | 0 | 6 | 0 | 0 | 0.00 |
| Scotland | 14 | 0 | 14 | 0 | 0 | 0.00 |
| TOTAL | 400 | 389 | 389 | 4 | 7 |
The matches abandoned or cancelled or forfeited are not included.
Result of Finals

IMAGE: Australia Captain Michael Clarke is carried on the shoulders of team-mates David Warner, left, and Aaron Finch as he holds the 2015 Cricket World Cup. Photograph: Hamish Blair/Reuters
| Year | Teams | How | Venue |
|---|---|---|---|
| 1975 | WEST INDIES (291/8) beat Australia (274) | by 17 runs | Lord's |
| 1979 | WEST INDIES (286/9) beat England (194) | by 92 runs | Lord's |
| 1983 | INDIA (183) beat West Indies (140) | by 43 runs | Lord's |
| 1987 | AUSTRALIA (253/5) beat England (246/8) | by 7 runs | Calcutta |
| 1992 | PAKISTAN (249/6) beat England (227) | by 22 runs | Melbourne |
| 1996 | SRI LANKA (245/3) beat Australia (241/7) | by 7 wickets | Lahore |
| 1999 | AUSTRALIA (133/2) beat Pakistan (132) | by 8 wickets | Lord's |
| 2003 | AUSTRALIA (359/2) beat India (234) | by 125 runs | Johannesburg |
| 2007 | AUSTRALIA (281/4) beat Sri Lanka (215/8) | by 53 runs | (D/L method) Bridgetown |
| 2011 | INDIA (277/4) beat Sri Lanka (274/6) | by 6 wickets | Mumbai |
| 2015 | AUSTRALIA (186/3) beat New Zealand (183) | by 7 wickets | Melbourne |
Scoring pattern for each World Cup
| Year | Games | Runs | Wickets | Runs/ wkt | Overs | Runs/ over |
|---|---|---|---|---|---|---|
| 1975 | 15 | 6162 | 208 | 29.62 | 1573.2 | 3.91 |
| 1979 | 14 | 5168 | 202 | 25.58 | 1457.4 | 3.54 |
| 1983 | 27 | 12046 | 408 | 29.52 | 2952 | 4.08 |
| 1987 | 27 | 12522 | 385 | 32.52 | 2568.5 | 4.87 |
| 1992 | 39 | 15107 | 514 | 29.39 | 3416.2 | 4.42 |
| 1996 | 36 | 15225 | 474 | 32.12 | 3259.2 | 4.66 |
| 1999 | 42 | 16963 | 597 | 28.41 | 3786.5 | 4.48 |
| 2003 | 52 | 20441 | 734 | 27.85 | 4293.5 | 4.76 |
| 2007 | 51 | 21333 | 725 | 29.42 | 4308.4 | 4.95 |
| 2011 | 49 | 21333 | 731 | 29.18 | 4237.3 | 5.03 |
| 2015 | 48 | 23531 | 715 | 32.91 | 4163.2 | 5.65 |
| TOTAL | 400 | 169,831 | 5,693 | 29.83 | 36,017.4 | 4.72 |
Highest innings totals
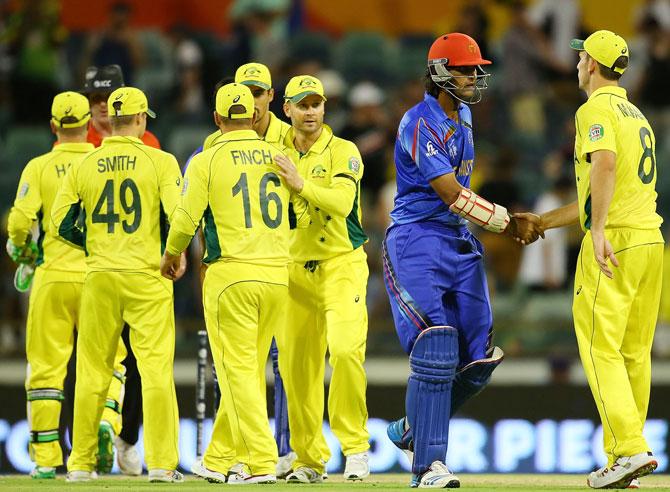
IMAGE: Shahpur Zadran of Afghanistan shakes hands with Mitchell Marsh of Australia after their World Cup game in Perth. Photograph: Paul Kane/Getty Images
| Total | Overs | Teams | Venue | Year |
|---|---|---|---|---|
| 417/6 | (50 overs) | Australia v Afghanistan | Perth | 2015 |
| 413/5 | (50 overs) | India v Bermuda | Port-of-Spain | 2007 |
| 411/4 | (50 overs) | South Africa v Ireland | Canberra | 2015 |
| 408/5 | (50 overs) | South Africa v West Indies | Sydney | 2015 |
| 398/5 | (50 overs) | Sri Lanka v Kenya | Kandy | 1996 |
| 393/6 | (50 overs) | New Zealand v West Indies | Wellington | 2015 |
| 377/6 | (50 overs) | Australia v South Africa | Basseterre | 2007 |
| 376/9 | (50 overs) | Australia v Sri Lanka | Sydney | 2015 |
| 373/6 | (50 overs) | India v Sri Lanka | Taunton | 1999 |
| 372/2 | (50 overs) | West Indies v Zimbabwe | Canberra | 2015 |
| 370/4 | (50 overs) | India v Bangladesh | Mirpur | 2011 |
Highest totals by a team batting second
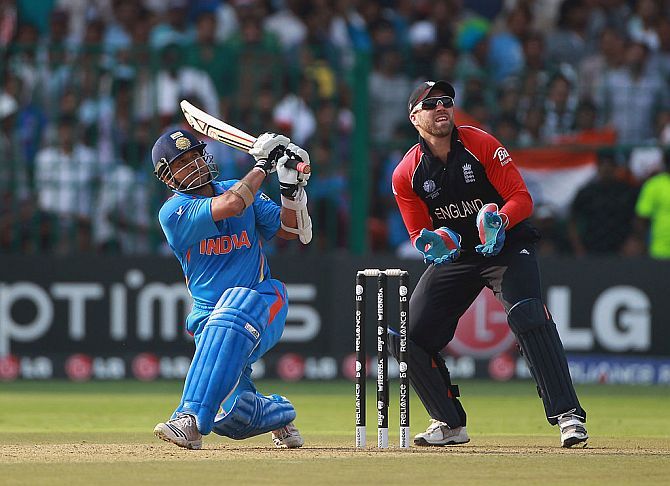
IMAGE: Sachin Tendulkar hits a six during the 2011 World Cup game against England at the M Chinnaswamy Stadium in Bengaluru on February 27, 2011. Photograph: Tom Shaw/Getty Images
| Total | Overs | Teams | Venue | Year |
|---|---|---|---|---|
| 338/8 | (50 overs) | England v India | Bangalore | 2011 |
| 329/7 | (49.1 overs) | Ireland v England | Bangalore | 2011 + |
| 326 | (49.3 overs) | Zimbabwe v Ireland | Hobart | 2015 |
| 322/4 | (48.1 overs) | Bangladesh v Scotland | Nelson | 2015 + |
| 313/7 | (49.2 overs) | Sri Lanka v Zimbabwe | New Plymouth | 1992 + |
| 312/1 | (47.2 overs) | Sri Lanka v England | Wellington | 2015 + |
+ winning totals
Highest match aggregates
| Total | Overs | Teams | Venue | Year |
|---|---|---|---|---|
| 688/18 | (96.2 overs) | Aus (376/9) v Sri Lanka (313/9) | Sydney | 2015 |
| 676-18 | (99.5 overs) | India (338) v England (338/8) | Bengaluru | 2011 |
| 671/16 | (98 overs) | Australia (377/6) v South Africa (294) | Basseterre | 2007 |
Lowest innings totals
(Completed Innings only)
| Total | Overs | Teams | Venue | Year |
|---|---|---|---|---|
| 36 | (18.4 overs) | Canada v Sri Lanka | Paarl | 2003 |
| 45 | (40.3 overs) | Canada v England | Manchester | 1979 |
| 45 | (14 overs) | Namibia v Australia | Potchefstroom | 2003 |
| 58 | (18.5 overs) | Bangladesh v West Indies | Mirpur | 2011 |
| 68 | (31.3 overs) | Scotland v West Indies | Leicester | 1999 |
| 69 | (23.5 overs) | Kenya v New Zealand | Chennai | 2011 |
| 74 | (40.2 overs) | Pakistan v England | Adelaide | 1992 |
| 77 | (27.4 overs) | Ireland v Sri Lanka | St.George's | 2007 |
| 78 | (24.4 overs) | Bermuda v Sri Lanka | Port-of-Spain | 2007 |
| 78 | (28 overs) | Bangladesh v South Africa | Mirpur | 2011 |
Lowest match aggregates
(in result-oriented games)
| Total | Overs | Teams | Venue | Year |
|---|---|---|---|---|
| 73/11 | (23.2 overs) | Canada v Sri Lanka | Paarl | 2003 |
| 91/12 | (54.2 overs) | England v Canada | Manchester | 1979 |
| 117/11 | (31.1 overs) | Bangladesh v West Indies | Mirpur | 2011 |
| 138/12 | (41.4 overs) | Scotland v West Indies | Leicester | 1999 |
Largest margins of victory
By wickets
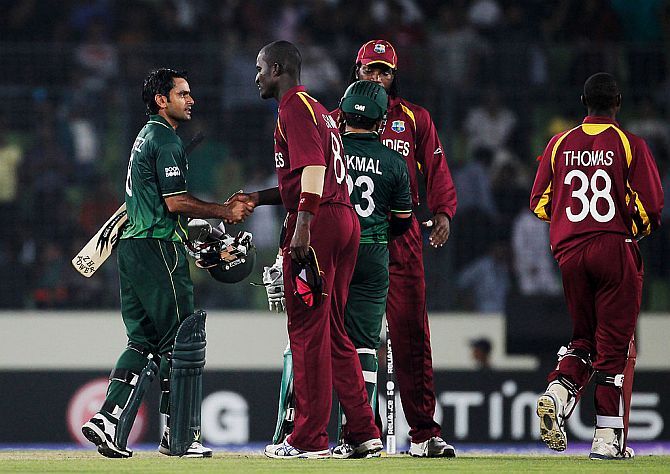
IMAGE: Pakistan's Mohammad Hafeez is congratulated by West Indies Captain Darren Sammy after the first quarter-final of the 2011 World Cup at the Shere-e-Bangla national stadium in Dhaka on March 23, 2011. Photograph: Daniel Berehulak/Getty Images
| Wickets | Teams | Venue | Year |
|---|---|---|---|
| 10 wickets | India beat East Africa | Leeds | 1975 |
| 10 wickets | West Indies beat Zimbabwe | Birmingham | 1983 |
| 10 wickets | West Indies beat Pakistan | Melbourne | 1992 |
| 10 wickets | South Africa beat Kenya | Potchefstroom | 2003 |
| 10 wickets | Sri Lanka beat Bangladesh | Pietermaritzburg | 2003 |
| 10 wickets | South Africa beat Bangladesh | Bloemfontein | 2003 |
| 10 wickets | Australia beat Bangladesh | North Sound | 2007 |
| 10 wickets | New Zealand beat Kenya | Chennai | 2011 |
| 10 wickets | New Zealand beat Zimbabwe | Ahmedabad | 2011 |
| 10 wickets | Pakistan beat West Indies | Mirpur | 2011 |
| 10 wickets | Sri Lanka beat England | Colombo RPS | 2011 |
By Runs
| Runs | Teams | Venue | Year |
|---|---|---|---|
| 275 runs | Australia beat Afghanistan | Perth | 2015 |
| 257 runs | India beat Bermuda | Port-of-Spain | 2007 |
| 257 runs | South Africa beat West Indies | Sydney | 2015 |
| 256 runs | Australia beat Namibia | Potchefstroom | 2003 |
| 243 runs | Sri Lanka beat Bermuda | Port-of-Spain | 2007 |
| 231 runs | South Africa beat Netherlands | Mohali | 2011 |
| 229 runs | Australia beat Netherlands | Basseterre | 2007 |
Narrowest margins of victory
| Teams | Venue | Year | ||
|---|---|---|---|---|
| 1 wicket | West Indies beat Pakistan | Birmingham | 1975 | (with two balls to spare) |
| 1 wicket | Pakistan beat West Indies | Lahore | 1987 | (off the last ball) |
| 1 wicket | South Africa beat Sri Lanka | Providence | 2007 | (with 10 balls to spare) |
| 1 wicket | England beat West Indies | Bridgetown | 2007 | (with one ball to spare) |
| 1 wicket | Afghanistan beat Scotland | Dunedin | 2015 | (with three balls to spare) |
| 1 wicket | New Zealand beat Australia | Auckland | 2015 | (with 161 balls to spare) |
| 2 wickets | New Zealand beat England | Birmingham | 1983 | (with one ball to spare) |
| 2 wickets | England beat West Indies | Gujranwala | 1987 | (with three balls to spare) |
| 2 wickets | Australia beat England | Port Elizabeth | 2003 | (with two balls to spare) |
| 2 wickets | Bangladesh beat England | Chittagong | 2011 | (with six balls to spare) |
| 2 wickets | Ireland beat UAE | Brisbane | 2015 | (with four balls to spare) |
| 1 run | Australia beat India | Madras | 1987 | (with two balls to spare) |
| 1 run | Australia beat India | Brisbane | 1992 | (off the last ball) |
| 2 runs | Sri Lanka beat England | North Sound | 2007 | (off the last ball) |
| 3 runs | New Zealand beat Zimbabwe | Hyderabad (Ind) | 1987 | (with two balls to spare) |
| 3 runs | Australia beat New Zealand | Indore | 1987 | (off the last ball) |
| 3 runs | Zimbabwe beat India | Leicester | 1999 | (with six balls to spare) |
| 3 runs | West Indies beat South Africa | Cape Town | 2003 | (off the last ball) |
Tied Matches
IMAGE: Zaheer Khan celebrates Andrew Strauss's wicket during the 2011 World Cup game at the M Chinnaswamy Stadium in Bengaluru on February 27, 2011. Photograph: Tom Shaw/Getty Images
| Teams | Venue | Year |
|---|---|---|
| Austalia (213) v South Africa (213) | Birmingham | 1999 |
| Sri Lanka (268/9) v South Africa (229/6) (D/L) | Durban | 2003 |
| Ireland (221/9) v Zimbabwe (221) | Kingston | 2007 |
| India (338) v England (338/8) | Bangalore | 2011 |
Quickest Victories (batting second)
| Overs | Score | Teams | Venue | Year |
|---|---|---|---|---|
| 4.4 | 37/1 | Sri Lanka v Canada | Paarl | 2003 |
| 8.0 | 72/0 | New Zealand v Kenya | Chennai | 2011 |
| 10.0 | 81/2 | Sri Lanka v Ireland | St.George's | 2007 |
| 10.1 | 70/2 | West Indies v Scotland | Leicester | 1999 |
| 12.0 | 109/0 | South Africa v Bangladesh | Bloemfontein | 2003 |
| 12.2 | 92/1 | Australia v Ireland | Bridgetown | 2007 |
| 12.2 | 59/1 | West Indies v Bangladesh | Mirpur | 2011 |
| 12.2 | 125/2 | New Zealand v England | Wellington | 2015 |
| 13.5 | 46/2 | England v Canada | Manchester | 1979 |
| 13.5 | 106/0 | Australia v Bangladesh | North Sound | 2007 |


 © 2025